
Lucidity, developed by Goal Solutions, is an innovative analytics platform designed to empower investors, originators, banks, credit unions, and colleges who have a need for enhanced data visualization and transparency. Drawing on CEO Matt Myers’ expertise in data science, Lucidity enables insightful, user-friendly visualizations and metrics in under 30 days while eliminating the need for internal investments in data engineers, data scientists, and other supporting resources at a potential annual savings of over $1 million. Below are the standout features and benefits for potential platform participants.

Lucidity Key Features and Benefits
Collateral Performance Module
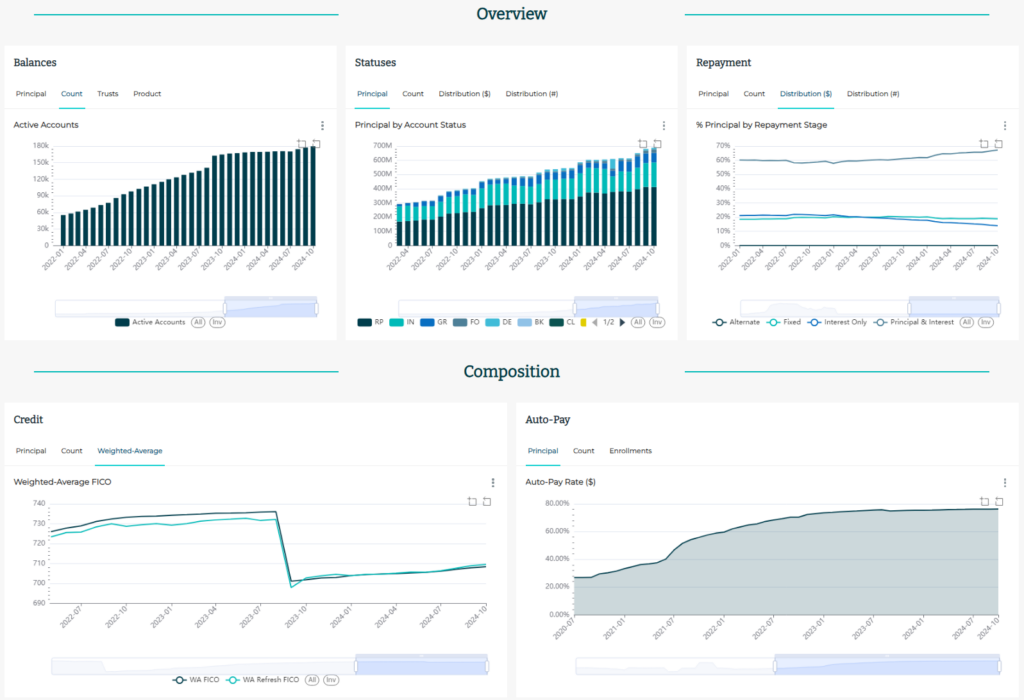
Key Features:
- Handcrafted Analytics: Developed by industry experts, Lucidity offers cutting-edge metrics and visualizations that we utilize in our own portfolios. Effortlessly manage performance, monitor activity, and uncover critical insights.
- At-a-Glance Insights: Gain immediate insights into your portfolio’s performance and activity with essential industry-standard metrics such as balances, delinquency rates, customer payments, and losses.
- Flexible Dashboards: Get a comprehensive view of your portfolio while retaining the ability to drill down into key trends with filters, zoom options, and multiple views for each metric, allowing for in-depth analysis of focus areas.
- Intuitive Data Visualization: Experience immersive, interactive charts and graphs that enable users to quickly identify trends, compare investments, and drill down into specific metrics.
- Detailed Loan and Payment Tracking: Monitor borrower payments monthly, including breakouts for historical trends on principal and interest components.
- Comprehensive Delinquency Insights: Analyze delinquency data across various portfolios, track different delinquency stages, and gain insight into key performance drivers.
- Debt Layering Module: Enhance your analysis with our add-on option for warehouse and securitization overlays, allowing for tracking of time-sensitive metrics like concentration limits, triggers, parity ratios, and more, with color-coded indicators to highlight potential risks.
- Comparative Analysis Tools: Easily layer in the most relevant data points for your portfolio, enabling quick comparisons and evaluations of anomalies across different trusts, vintages, asset classes, and products.
- Sophisticated Filtering and Drill-Down Capabilities: Filter data across various metrics, portfolios, and time periods, allowing for a focused analysis on areas that require attention.
- Insights in a Box: Leverage our decades of loan management experience with our “Insights in a Box” option. Receive user-friendly, proven visualizations and metrics in under 30 days, eliminating the need for internal investments in data engineers, data scientists, and other supporting resources.
- Insights Outside of the Box: Opt for bespoke, custom-built dashboards tailored to your specific needs. Start from scratch or customize existing templates to meet your unique requirements.
- Data Normalization: Say goodbye to messy data. Our extensive experience with various servicers and platforms ensures our data normalization process transforms incoherent noise into actionable insights. ensures that our add-on data normalization process can turn incoherent noise into actionable insights.
- Customer Experience Intelligence: Track customer feedback trends and operational concerns across portfolios to identify emerging issues and potential areas for improvement.
- Issue Identification & Root Cause Analysis: Surface recurring themes across products, contractors, merchants, installers, and other delivery partners to support proactive problem resolution.
Benefits:
- Proactive Management: Lucidity prevents unpleasant surprises by enabling clients to stay ahead of potential issues regarding eligibility and cash flow impacts.
- Enhanced Transparency: With improved access to essential metrics, clients can feel more secure in their decision-making processes, ultimately leading to better financial outcomes.
- Informed Decision Making: The platform’s extensive metrics and reporting features provide a holistic view of portfolio health, allowing clients to make well-informed decisions quickly.
- User-Friendly Experience: Designed for maximum information intake with minimal effort, Lucidity’s intuitive layout reduces the learning curve for users and boosts overall engagement.
- Improved Customer Experience: Better visibility into customer concerns helps organizations identify opportunities to strengthen communications, workflows, and service outcomes.
- Stronger Third-Party Oversight: Enhanced transparency into contractor, merchant, installer, and vendor-related trends supports more informed operational decision-making.
- Earlier Trend Detection: Identify emerging operational issues before they become broader customer, compliance, or portfolio performance concerns.
- Operational Efficiency Gains: On-demand access to reporting and analysis reduces reliance on manual reporting processes and accelerates issue investigation.
Warehouse and ABS Module

Forecast-to-Actual Module
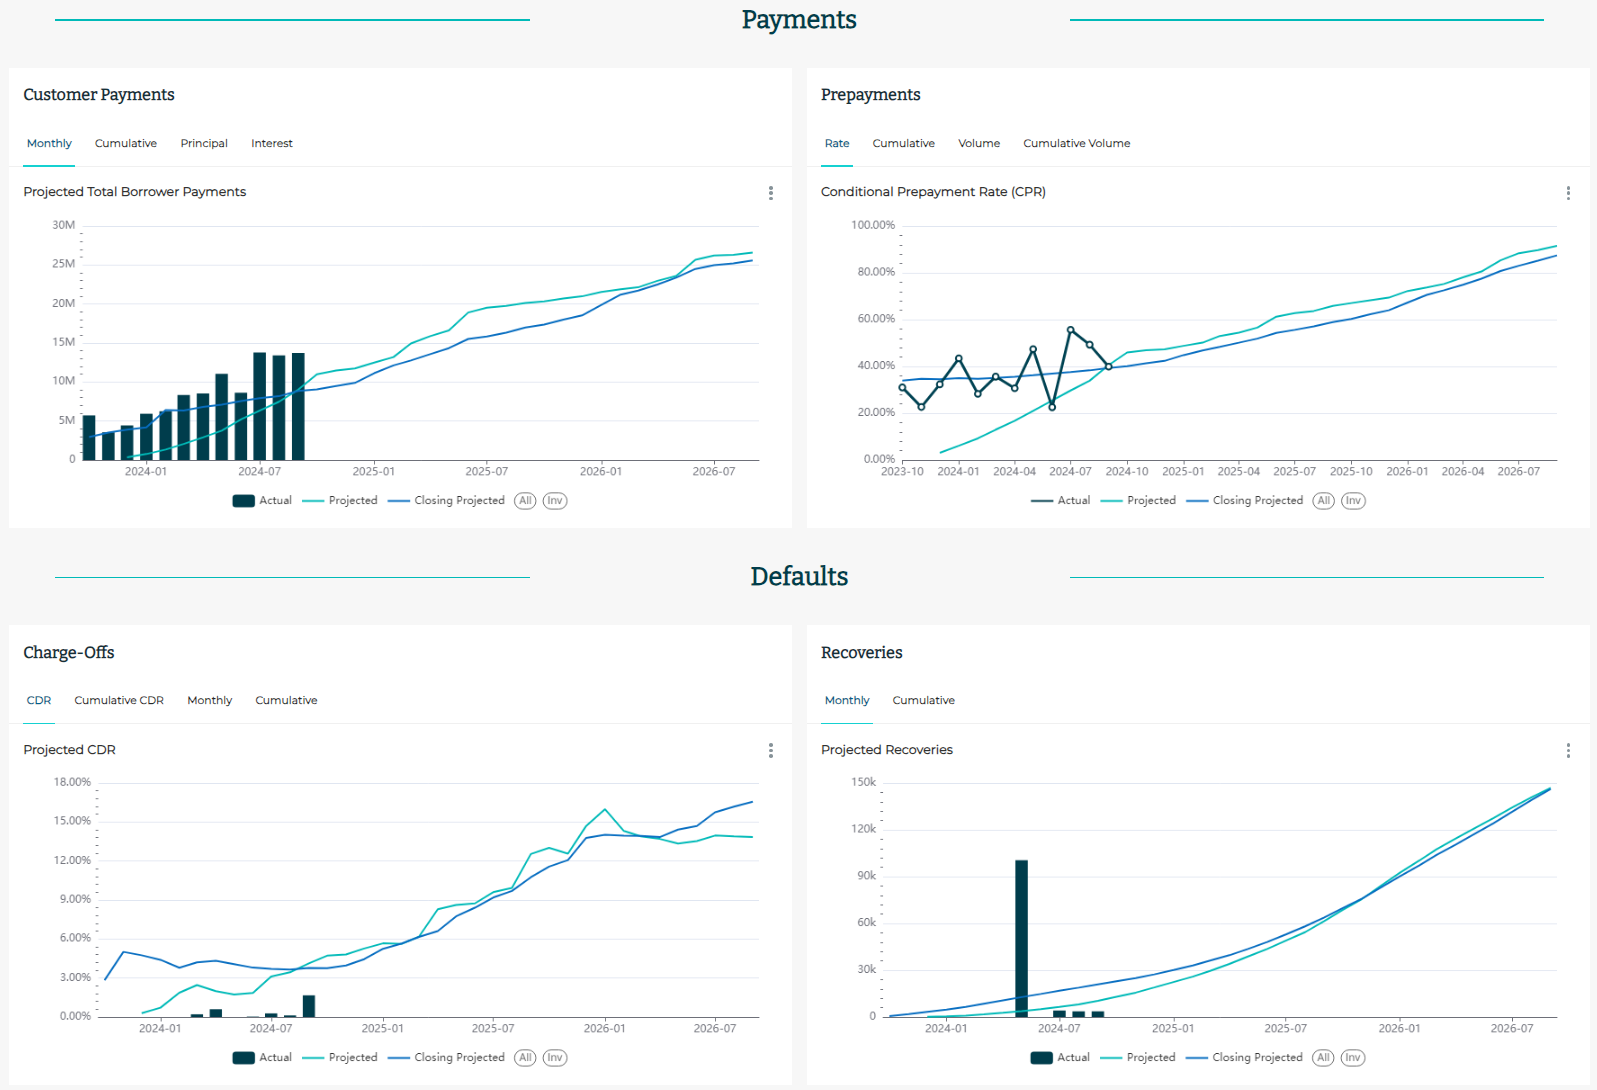
As originally conceived, Lucidity is uniquely positioned to transform how clients track, analyze, and manage their portfolios, ensuring a comprehensive understanding of portfolio performance while minimizing risk. With its combination of cutting-edge data visualization, customizability, and proactive management capabilities, Lucidity stands out as an essential tool for today’s deeply data driven clients.